Log-log graph paper PDF
Logarithmic on both axes: the paper for power laws and wide-ranging data.
Download the Log-log graph paper PDF
Ready-made portrait file with a 10 mm margin. Print at 100% for true-size squares. No sign-up, no watermark.
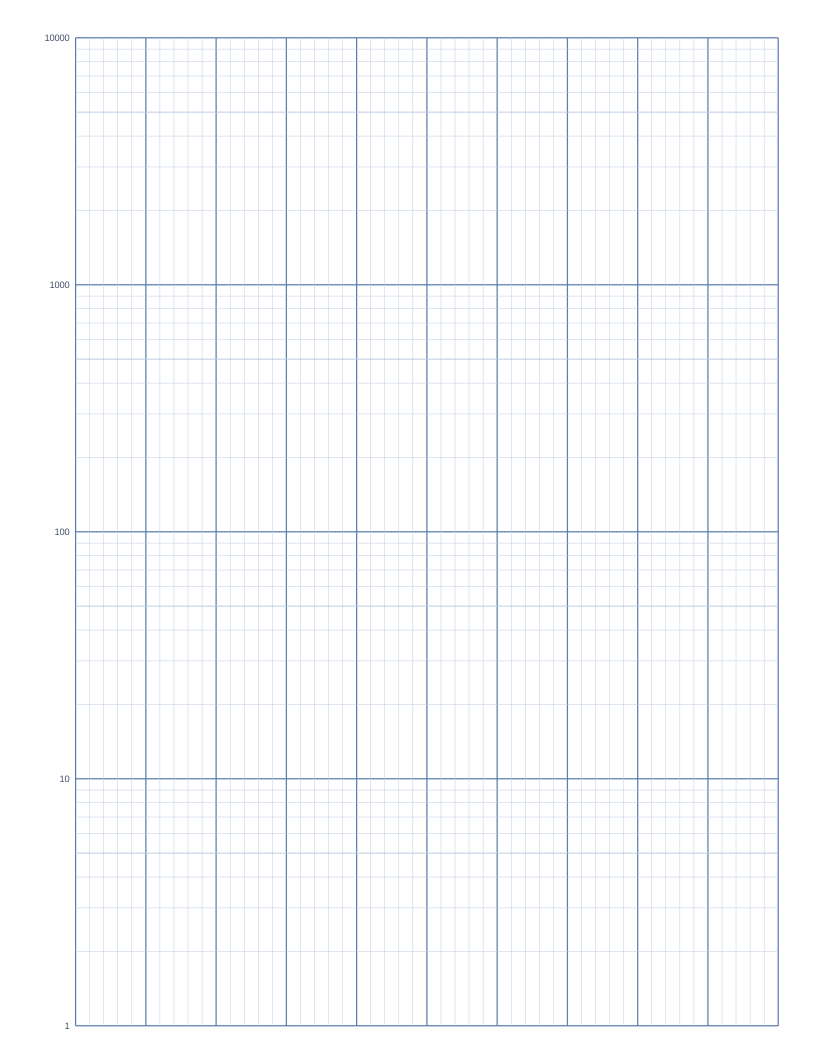
- Horizontal axis
- Logarithmic3 cycles, labelled
- Vertical axis
- Logarithmic3 cycles, labelled
- Lines per decade
- 91 and 5 emphasised
- Range
- AnyChoose the starting power
On log-log paper both scales are logarithmic. A relationship of the form y = a x^n appears as a straight line, with slope n, so you can find the exponent by measuring the slope. Scaling laws, flow and pressure relationships, and frequency response plots are commonly drawn on it.
The 3 by 3 page covers three decades on each axis. The 4 by 4 page covers four, and the generator allows up to seven. Every decade is divided at 1 through 9, and the decades are numbered as powers of ten.
Good for
- Power-law fitting in physics and biology
- Bode magnitude plots
- Loudness, magnitude and pH data
- Allometric scaling in biology
Printing tips
- Do not try to plot zero or negative values: they have no logarithm.
- Use a clear ruler so you can see the grid through it.
- Need the full checklist? Read how to print grid paper at true size.
Change it before you download
The generator below starts with this exact paper. Adjust the square size, colours, margin or paper size and save your own PDF.
Frequently asked questions
What does a straight line on log-log paper mean?
The data follows a power law, y = a x^n.
How do I find the exponent?
Measure the slope as the change in log y divided by the change in log x. In cycles, count the cycles up divided by the cycles across.
Can the two axes have different cycle counts?
Yes. Set them separately in the generator.