Semi-log graph paper PDF
Linear across, logarithmic up: the paper for exponential growth and decay.
Download the Semi-log graph paper PDF
Ready-made portrait file with a 10 mm margin. Print at 100% for true-size squares. No sign-up, no watermark.
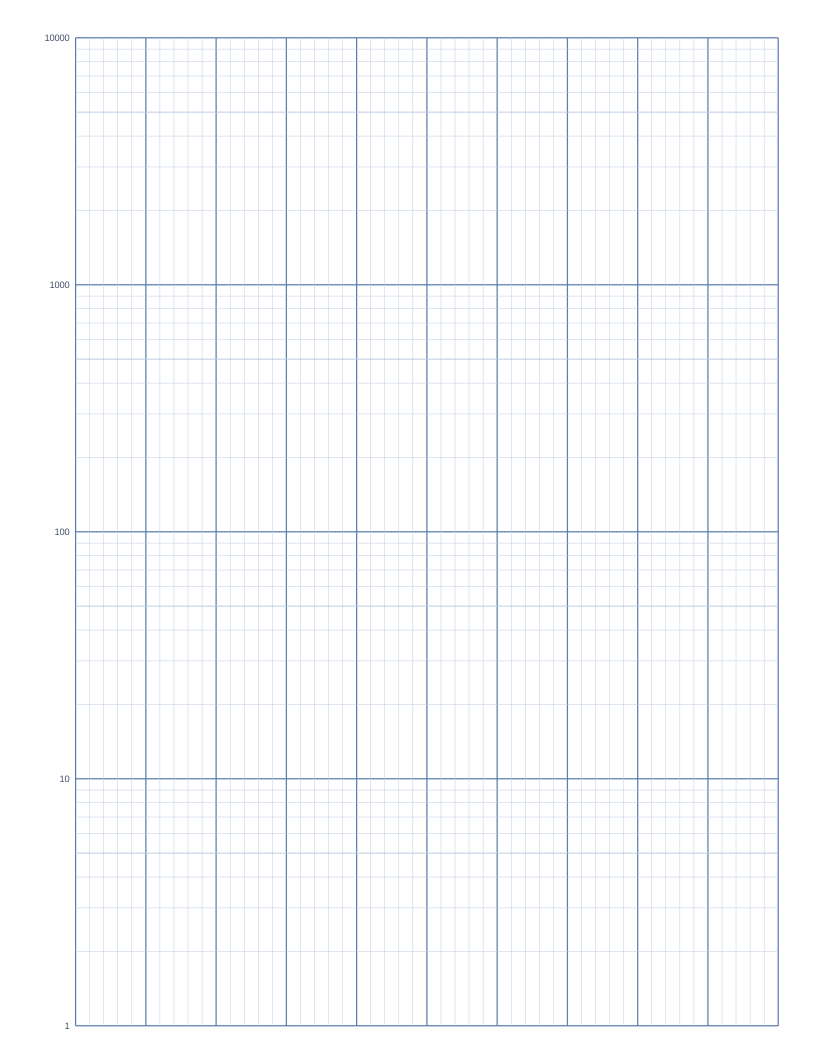
- Vertical axis
- Logarithmic3 cycles, labelled
- Horizontal axis
- Linear10 divisions
- Lines per decade
- 91 and 5 emphasised
- Range
- AnyChoose the starting power
Semi-log paper has an ordinary scale along the bottom and a logarithmic scale up the side. Any quantity that doubles at regular intervals, or halves, traces a straight line on it, so you can read the growth rate from the slope.
The three-cycle version below covers a thousandfold range, for example from 1 to 1000. Use the 2-cycle version for ranges up to 100, and the 4-cycle version for ranges up to 10000. Each cycle is numbered as a power of ten.
Good for
- Bacterial growth, half-life and decay curves
- Compound interest and population growth
- Capacitor charging and discharging
- Any data that changes by a constant percentage
Printing tips
- Start the scale at the exponent that suits your data, using the generator.
- Fit a ruler line through your data points. A straight line confirms an exponential model.
- Need the full checklist? Read how to print grid paper at true size.
Change it before you download
The generator below starts with this exact paper. Adjust the square size, colours, margin or paper size and save your own PDF.
Frequently asked questions
How many cycles do I need?
Divide the largest value by the smallest and count the factors of ten. A ratio of 800 needs three cycles.
Can I change the horizontal divisions?
Yes. The default has 10 divisions with 5 lines in each.
What about log-log?
Use the log-log page when both axes need a logarithmic scale.